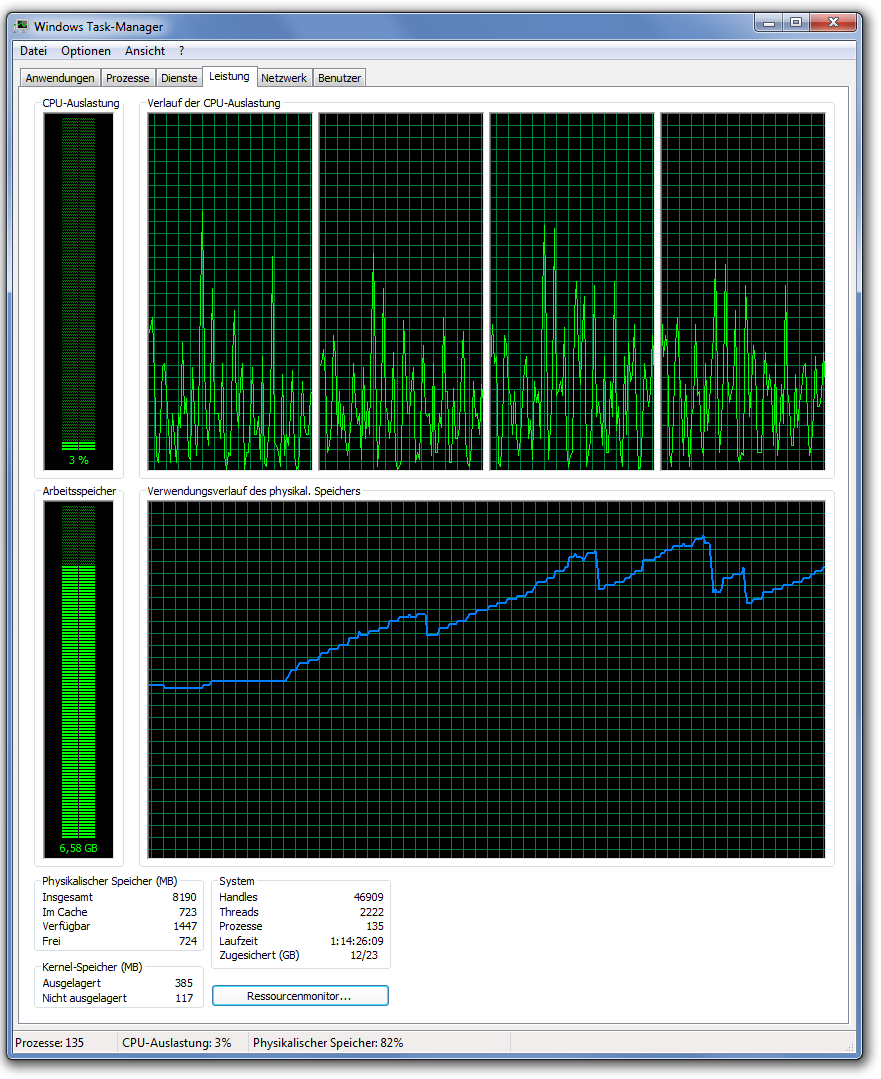
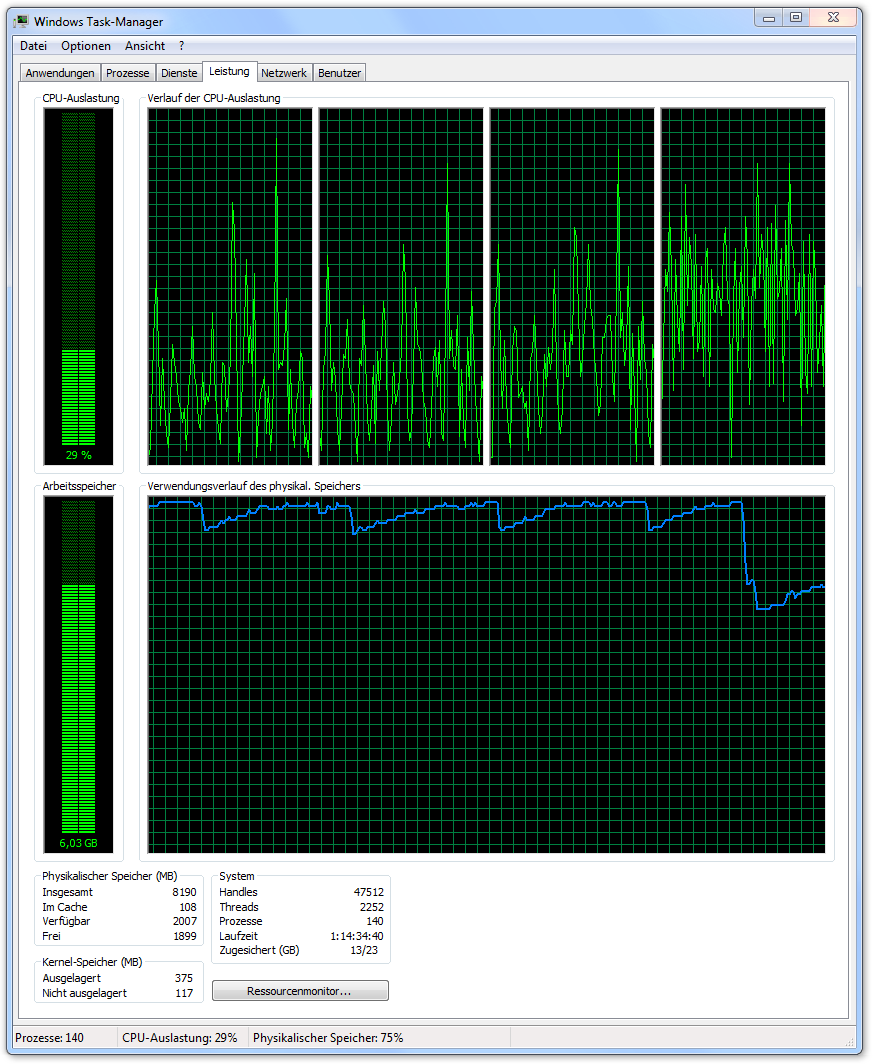
Some minutes ago Firefox crashed and I saw Windows freeing up more than 6 GB of memory. After the restart I checked the task manager and the problem persisted: every few seconds there is a short peak with 25% CPU usage (which apparently accounts for full usage of one core of my quad core CPU) and the memory usage increases slowly. The memory usage is interrupted by a partial drop after a few minutes but ultimately it increases until all of the system memory is eaten up and the browser crashes again.
To narrow down the problem I started by diasbling all add-ons until the problem vanished. This allowed me to reenable all add-ons except Kee (version 2.2.9). I could narrow the problem down to this page:
Changing the logging in Kee to debug logging I get this in the console:
port already set to: page
common.js:215:17
In browser content page script, received message from background script
common.js:197:17
Logging system config updated at Thu Mar 22 2018 18:10:26 GMT+0100
common.js:206:17
Messaging port was not established at page startup. Retrying now...
common.js:206:17
port already set to: page
common.js:215:17
Messaging port was not established at page startup. Retrying now...
common.js:206:17
port already set to: page
common.js:215:17
Messaging port was not established at page startup. Retrying now...
common.js:206:17
port already set to: page
common.js:215:17
In browser content page script, received message from background script
common.js:197:17
Logging system config updated at Thu Mar 22 2018 18:10:26 GMT+0100
common.js:206:17
In browser content page script, received message from background script
common.js:197:17
Logging system config updated at Thu Mar 22 2018 18:10:26 GMT+0100
common.js:206:17
Messaging port was not established at page startup. Retrying now...
This never stops. The messages keep on coming.
I wanted to get this error report out before investigating the situation any further. I will now check with a portable version of Firefox with only Kee installed and then try with older versions. There will be updates to this initial report.
Update: The problem could be reproduced with Portable Firefox 59.0.1 and just the Kee add-on 2.2.9 installed when loading the page that is linked above. The browser did not crash after 20 minutes, but the CPU spikes were there and the memory usage kept increasing.
I’ve been looking into this today using that web page and can’t find anything much to add at the moment unfortunately. All the Firefox diagnostics I’ve looked at so far claim that Kee is not using any unusual amount of memory so all that usage may be somewhere else within Firefox. I’ll try some more long-running tests in the coming weeks but might not have time for more than one or two tests since it seems to take half a day or more for the problem to manifest and I’ve not really got any spare time for a couple of weeks so if I don’t find something noteworthy soon it might be a while before I reply again.
The drop in your 3rd post could be a process crashing rather than a GC. Firefox does not yet recover from a crashed add-on process but if the memory is being used by a content (page) process then you would potentially see a “tab crashed” message in one or more tabs (and since Firefox indicates to me that it is not the add-on process that’s using up memory anyway, that might all align).
I’m not even sure if the slight increase in memory is the same issue you’re seeing - I’m on Windows 10 so there could easily be different causes on older versions of Windows and I’m yet to see it get to the point of such high memory pressure that I can rule out very lazy GC algorithms within Firefox. I’ve only tested on FF61 so there’s a small chance they’ve changed something since FF59.
I’m also not sure if all of the same multi-process stability and performance enhancements we see on Windows 10 would be applied on old versions of Windows too.
Which version of Windows are you using?
That could very well be true. The whole problem caught me by surprise. I had never had any problems with Keefox or Kee before and when Firefox crashed because of too much memeroy usage I had to search for quite some time to isolate the cause. In the second test with Portable Firefox 59.0.1 and just Kee installed it could be reproduced with that very sae web ae (but, for example, not by the home page of the same domain) but not to the point of the very same crash. I think I would need to wait some hours until it happens again just as it came out of nowhere after hours of use. Frankly, the real bug is not the crash but the fact that this situation eats up more and more memory in the first place.
The log messages in a loop also seem to indicate that something is wrong with Kee. There should be a limit for “Retrying now…” after a page has been loaded. Doing this ad infinitum certainly doesn’t help in reducing the memory usage. Perhaps enforcing some limit for those retries will do the trick.
That could be true. I will do the test once more and see if one of the processes is terminated.
I’m on Windows 7 Ultimate, fully updated. If the difference between the Windows versions is responsible for this, then this almost certainly is a very weird Firefox problem. I would much prefer if the problem could be reproduced with Windows 10, because the alternative is some highly esoteric edge case that could take ages to find and fix.
Sorry for coming back so late. Now I have data using the Firefox Nightly 61.0a1 (2018-04-12) (32-bit) on Windows 7 x64 Ultimate. The browser was downloaded from PortableApps.com and then used with freshly, with no other add-ons beside Kee installed. I used the same link to ComputerBase for the sake of reproducibility.
The problem is very much the same, with the browser eating up all of the available memory. It didn’t come to a crash this time. The bigger drops are not crashes of individual processes of the browser, the PIDs in the task manager remained the same after the drop. After more than half an hour, there was a drop that resulted in a stop of the problematic behaviour, just as if Firefox killed and blocked the offending script or Kee had finlly reached some maximum run count.
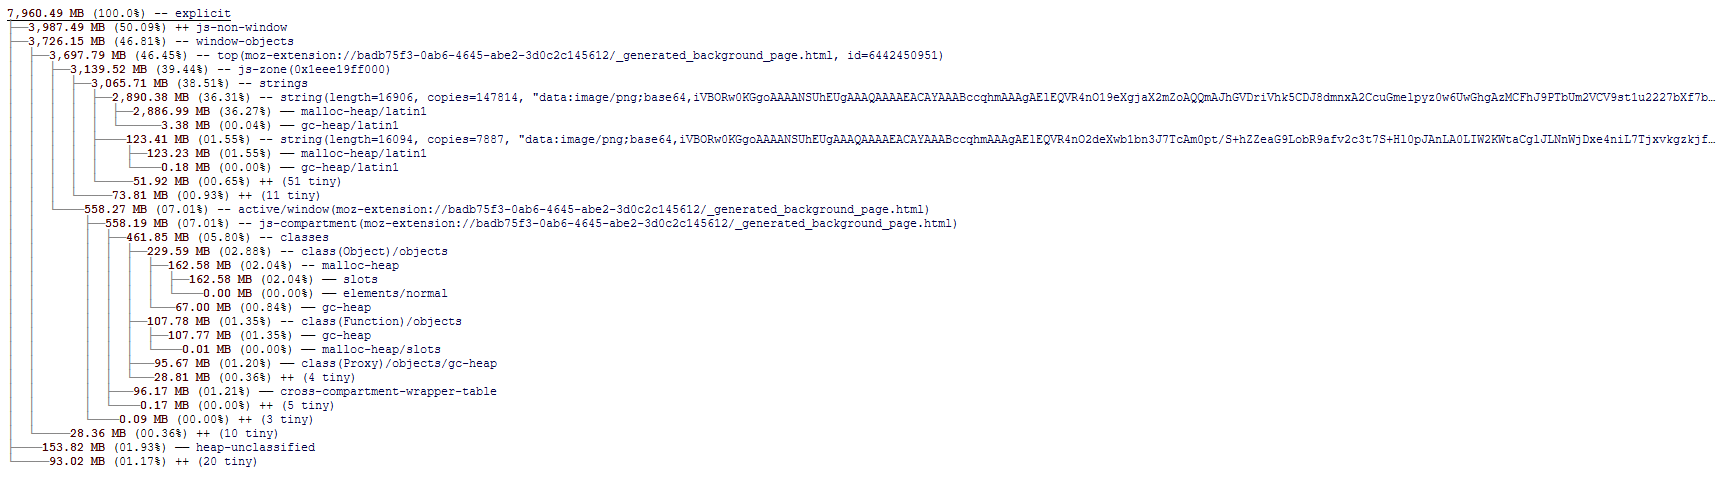
I have observed the same issue, it seems to have to do with the “_generated_background_page.html”. It seems, the addon generates heaps of temporary images and stores them as a base64 encoded string.
Although I now can’t find it, I am certain that I read about a Firefox bug that was fixed in the past month or so which may be relevant to this. Essentially, until one of the latest versions of Firefox Nightly, the browser action icon is recreated at an extremely high rate (I can’t recall if it was per mouse movement over the toolbar or 60 times per second).
If the icons that are being generated and stored in memory hundreds of thousands of times are the same icons that are associated with the browser action icon (which I suspect they are because of their location in the background page DOM) we should expect a very significant improvement in the latest Nightly.
There is probably something else that we can do in Kee to ensure that we don’t end up with a new version of this string each time anyway but I won’t have time to investigate that for a while so with a bit of luck, that will become an almost imperceptible memory utilisation improvement that is dwarfed by the use of the latest Firefox version.
It would be great if you could report back in the coming weeks as to whether the problem is still reproducible in Firefox 62.
If it’s still a problem, seeing the full string of those icons could help me narrow down the cause in future (I’m expecting the them to be the main KeeFox icon and either a greyed out version of it or one with a yellow background but it would be interesting if they are instead variations with number icons.
just to give an update: the issue ist sill present with Firefox 60.0.2, but it seems a bit more “tame”. I will definitely give an update after Firefox 62 is released.
Hi, I confirm the above described behavior with the following page
www.hasznaltauto.hu (this is a Hungarian used car market), just search for a car using the drop down boxes and open a few pages. If needed I can provide a few random links.
As I experienced if you have only a few pages open from this site, the memory usage increases quite slowly, but if you have e.g. 8 open pages, it eats up 2-4 GB in 30-60 minutes. Sometimes longer, sometimes shorter. It starts slowly and after the usage grows faster. Disabling kee immediately frees up memory without closing firefox. Re-enabling kee increases memory usage again.
I have tested with firefox 60.0.2 under windows 10 and opensuse tumbleweed using latest kee and keepass
1400 copies in memory of this:
data:image/svg+xml;base64,PHN2ZyB4bWxucz0iaHR0cDovL3d3dy53My5vcmcvMjAwMC9zdmciIHdpZHRoPSI2NCIgaGVpZ2h0PSI2NCI+Cgk8c3R5bGU+CglAbWVkaWEgKHByZWZlcnMtY29sb3Itc2NoZW1lOiBkYXJrKSB7CgkJLmJhY2tncm91bmQgewoJCQlmaWxsOiAjMTIxMjEyOwoJCX0KCQkubGV0dGVyLWIgewoJCQlmaWxsOiAjZTg0ZDBlOwoJCX0KCX0KCTwvc3R5bGU+Cgk8cmVjdCB4PSIwIiB5PSIwIiB3aWR0aD0iNjQiIGhlaWdodD0iNjQiIHJ4PSIxMCIgZmlsbD0iIzJjNWI5YyIgY2xhc3M9ImJhY2tncm91bmQiLz4KCTxwYXRoIGQ9Ik0zOC42OCA4Ljc2MmMtMS41Ni0uOTAxLTMuMzM5LTEuNi01LjI4LTIuMDYzQzMxLjQ2NSA2LjIzNiAyOS4zNDQgNiAyNy4xMDEgNmMtMi44MDMgMC01LjUyNS41MzYtOC4wNjggMS41ODQtMi41NTkgMS4wNDgtNC43NzcgMi41MjctNi42MDUgNC4zOTYtMS44NjkgMS45MjYtMy4zNTYgNC4yMzMtNC40MiA2Ljg2Ni0xLjA2NSAyLjY0LTEuNjA5IDUuNjA2LTEuNjA5IDguODQgMCA0LjE1MSAxLjI1MSA3LjM5MyAzLjcxMyA5LjYyOCAyLjQ0NiAyLjIzNCA1Ljk0OCAzLjM2MyAxMC40MDggMy4zNjMgMS42MzMgMCAyLjkzMy0uMDggMy44Ni0uMjQzYTI4LjA1OCAyOC4wNTggMCAwMDIuOTU3LS43MDcgMjEuNzIxIDIxLjcyMSAwIDAwMi41NDMtLjkyNmMuODYxLS4zNjYgMS42MTctLjY4MyAyLjI1OS0uOTQzYS40NzcuNDc3IDAgMDAuMjkyLS4zNDFsMS44ODUtNy43NTFjLjAzMy0uMTQ3IDAtLjMwMS0uMDg5LS40MjNhLjQ3OC40NzggMCAwMC0uMzktLjE4N2gtLjg2MWMtLjExNCAwLS4yMi4wNC0uMzA5LjEwNmEyMy4zNjUgMjMuMzY1IDAgMDEtNC44NSAzLjAxNCAxMi44MDEgMTIuODAxIDAgMDEtNS4zOTYgMS4xNjJjLTIuMDcxIDAtMy42NjQtLjUzNi00LjcxMi0xLjYtMS4wNTYtMS4wNTctMS41ODQtMi44MzYtMS41ODQtNS4yNzQgMC0zLjg4MyAxLjAxNS03LjEyNSAzLjAxNC05LjYyIDIuMDA3LTIuNDk0IDQuNDg1LTMuNzA1IDcuNTcyLTMuNzA1IDEuNzQ3IDAgMy4yODMuMzMzIDQuNTU5Ljk5MiAxLjMuNjY2IDIuNjMyIDEuNzMgMy45NTYgMy4xNi4wOS4wOTguMjIuMTU1LjM1OC4xNTVoLjk1YS40OTUuNDk1IDAgMDAuNDgtLjM3NGwxLjkwMS03Ljg2NWEuNTA4LjUwOCAwIDAwLS4yMzUtLjU0NXoiIGZpbGw9IiNmZmYiIGNsYXNzPSJsZXR0ZXItYyIvPgoJPHBhdGggZD0iTTUxLjgzNSA0MC4zMTJjMS43NDctLjY2NiAzLjA5Ni0xLjU2IDQuMDM4LTIuNjkgMS4xNDYtMS4zNzMgMS43My0zLjEyIDEuNzMtNS4yMDggMC0yLjQ5NC0xLjExMi00LjQ2LTMuMzA2LTUuODMzLTIuMTItMS4zMjUtNS4yLTItOS4xNTctMkgzMy4zODNhLjQ5Ni40OTYgMCAwMC0uNDguMzgzbC0uODIgMy41NjdjLjAyNC0uMDE3LjA0OS0uMDMzLjA3My0uMDU3LjI2LS4yMTEuNTg1LS4zMjUuOTE4LS4zMjVoLjg2MmMuNDU1IDAgLjg3Ny4yMDMgMS4xNjIuNTY5LjI4NC4zNTcuMzgxLjgyLjI2OCAxLjI2N2wtMS44ODUgNy43NTFhMS40NzcgMS40NzcgMCAwMS0uODg2IDEuMDI0Yy0uNjI2LjI1Mi0xLjM2NS41Ni0yLjI0Mi45MzQtLjMxLjEzLS42MTguMjUyLS45MTkuMzc0TDI1LjQ3IDU3LjM4M2MtLjAzMi4xNDYgMCAuMy4wOTguNDIyYS40OTMuNDkzIDAgMDAuMzgyLjE5NWgxMy45NWM1LjE1MiAwIDkuMjE0LTEgMTIuMDU4LTIuOTU3IDIuOTA5LTIuMDA3IDQuMzgtNC44MzUgNC4zOC04LjQwMiAwLTEuODY4LS41MDUtMy4zNC0xLjQ4OC00LjM4Ny0uNzM5LS43OTYtMS43NTUtMS40NDYtMy4wMTQtMS45NDJ6bS02LjY2MyA5LjYyOGMtMS4yMjYuNzQ3LTMuMDIyIDEuMTMtNS4zMzggMS4xM0gzNi4yNmwxLjYyNS03LjA5NGgzLjk1N2MxLjgyIDAgMy4xNTMuMjQ0IDMuOTY1LjcyMy43NC40NCAxLjA5NyAxLjE0NiAxLjA5NyAyLjE1MyAwIDEuMzY1LS41NjkgMi4zODEtMS43MyAzLjA4OHptMS4zNS0xMy41MmMtLjkyNy42NDItMi4yNi45NjctMy45NjYuOTY3aC0zLjE2OWwxLjM1LTUuODc1aDMuMzQ3YzEuMjM1IDAgMi4yMDIuMTk1IDIuODY4LjU3Ny41OTMuMzQyLjg3Ny44Ny44NzcgMS42NSAwIDEuMTk0LS40MyAyLjA3Mi0xLjMwOCAyLjY4MXoiIGZpbGw9IiNmZmYiIGNsYXNzPSJsZXR0ZXItYiIvPgo8L3N2Zz4K
1500 copies of this:
data:image/x-icon;base64,AAABAAEAEBAAAAAAIABoBAAAFgAAACgAAAAQAAAAIAAAAAEAIAAAAAAAQAQAAAAAAAAAAAAAAAAAAAAAAABmq/b/Zqv2/2ar9v9mq/b/Zqv2/2ar9v9mq/b/Zqv2/2ar9v9mq/b/Zqv2/2ar9v9mq/b/Zqv2/2ar9v9mq/b/Zqv2/2ar9v9mq/b/Zqv2/2ar9v9mq/b/Zqv2/2ar9v9mq/b/Zqv2/2ar9v9mq/b/Zqv2/2ar9v9mq/b/Zqv2/2ar9v9mq/b/Zqv2/2ar9v9mq/b/Zqv2/2ar9v9mq/b/Zqv2/2ar9v9mq/b/Zqv2/2ar9v9mq/b/Zqv2/2ar9v9mq/b/Zqv2/6HL+f/p8/7/stX6/3Sz9/9mq/b/1Oj8/4/B+P9mq/b/mMf5/+Lv/f/p8/7/ocv5/2ar9v9mq/b/Zqv2/2ar9v9mq/b/xN/8/2ar9v9mq/b/erb3//7+///H4Pz/Zqv2/2ar9v+72fv/y+L8/2ar9v9mq/b/Zqv2/2ar9v9mq/b/Zqv2/8Dc+/9mq/b/Zqv2/7bX+//r9P7/utn7/3Gx9/9mq/b/t9f7/8nh/P9mq/b/Zqv2/2ar9v9mq/b/Zqv2/2ar9v/A3Pv/Zqv2/2is9v/v9v7/r9P6/4K6+P+nz/r/Zqv2/7fX+//J4fz/Zqv2/2ar9v9mq/b/Zqv2/2ar9v9mq/b/wNz7/2ar9v+Xxvn//f7//3Wz9/9mq/b/xuD8/2ar9v+31/v/yeH8/2ar9v9mq/b/Zqv2/2ar9v9mq/b/Zqv2/8Dc+/9mq/b/0+f8/8/l/P9mq/b/Zqv2/6bO+v+FvPj/t9f7/8nh/P9mq/b/Zqv2/2ar9v9mq/b/Zqv2/2ar9v/A3Pv/ebX3//7+//+TxPn/Zqv2/2ar9v9xsff/vNr7/7fX+//J4fz/Zqv2/2ar9v9mq/b/Zqv2/2ar9v9mq/b/wNz7/7PV+//u9v7/aKz2/2ar9v9mq/b/Zqv2/8Hd+/+82vv/yeH8/2ar9v9mq/b/Zqv2/2ar9v9mq/b/Zqv2/8Pe+//v9v7/tNb7/2ar9v9mq/b/Zqv2/2ar9v+Qwvj/7vX+/8ri/P9mq/b/Zqv2/2ar9v9mq/b/Zqv2/6HL+f/x9/7//v7//3m29/9mq/b/Zqv2/2ar9v9mq/b/Z6z2/+31/v/x9/7/ocv5/2ar9v9mq/b/Zqv2/2ar9v9mq/b/Zqv2/2ar9v9mq/b/Zqv2/2ar9v9mq/b/Zqv2/2ar9v9mq/b/Zqv2/2ar9v9mq/b/Zqv2/2ar9v9mq/b/Zqv2/2ar9v9mq/b/Zqv2/2ar9v9mq/b/Zqv2/2ar9v9mq/b/Zqv2/2ar9v9mq/b/Zqv2/2ar9v9mq/b/Zqv2/2ar9v9mq/b/Zqv2/2ar9v9mq/b/Zqv2/2ar9v9mq/b/Zqv2/2ar9v9mq/b/Zqv2/2ar9v9mq/b/AAD//wAA//8AAP//AAD//wAA//8AAP//AAD//wAA//8AAP//AAD//wAA//8AAP//AAD//wAA//8AAP//AAD//w==
@rjt , I’m not sure of the format of that pasted data from F12 memory. Are you saying this is a problem? If so, it’s probably unrelated the issue of icons.
When looking at about:memory, filtering for “x-icon” and selecting the “WebExtensions” process, I see a handful of uses of icons in Kee and many other extensions. I don’t see any indication of the excessive icon storage mention in this thread, even after waiting for some time, interacting with pages, refreshing pages, etc.
I also am not even sure if this is a problem? Do we know for sure that this large figure is indicative of actual memory being used or is it just Firefox’s way of representing some virtual memory? I’m afraid that without more information about the system environment and websites that can trigger this problem, I will not be able to investigate any further.